

Latex + R + tikzDevice = Ggplots beautifully integrated in latex documents
Implementing nice looking plots in a \(\LaTeX\) document was harder than expected. I use R (through Rstudio) combined with ggplot2 (Grammar of Graphics plot) to plot my data and wanted a convenient way to insert my plots into Latex documents. I use something similar with Inkscape. It automatically sets the right font, properly writes Latex symbols and respects the proper font sizes.
The best solution I found is using the tikzDevice package for R and the tikz (available in the pgf package) package from LaTeX. TikZ plots will consist of vectors that will directly be coded into the LaTeX document so that there is no loss in image quality.
First you need to install tikzDevice in R through install.packages("tikzDevice"). For the following example to work, you will also need to install ggplot2.
Once you have both R packages, you can use this Rscript as an example:
	library(tikzDevice)
	library(ggplot2)
	#For some reason, Rstudio needs to know the time zone...
	options(tz="CA")
	#Dummy data for the plot
	y <- exp(seq(1,10,.1))
	x <- 1:length(y)
	data <- data.frame(x = x, y = y)

	#Create a .tex file that will contain your plot as vectors
	#You need to set the size of your plot here, if you do it in LaTeX, font consistency with the rest of the document will be lost
	tikz(file = "plot_test.tex", width = 5, height = 5)
	#Simple plot of the dummy data using LaTeX elements
	plot <- ggplot(data, aes(x = x, y = y)) +
		geom_line() +
		#Space does not appear after Latex
		ggtitle( paste("Fancy \\LaTeX ", "\\hspace{0.01cm} title")) +
		labs( x = "$x$ = Time", y = "$\\Phi$ = Innovation output") +
		theme_bw()
	#This line is only necessary if you want to preview the plot right after compiling
	print(plot)
	#Necessary to close or the tikxDevice .tex file will not be written
	dev.off()
The output provided by this script in R looks like this:
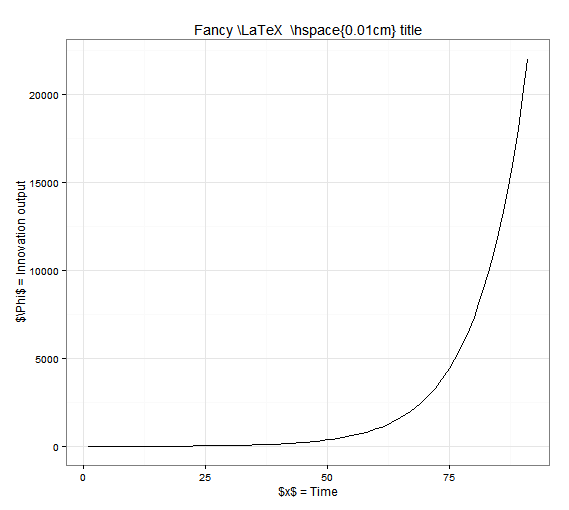
As you can see, the LaTeX codes are clearly visible. The font is R’s default font for now. If you check the folder where you sourced your file, you will find a test.tex file(you can check its content for this specific case by clicking on it) which contains the plot information as vectors. Every line, word or symbol is included as latex instructions in this .tex file. You should now create a .tex (any name will do) in the same folder your plot_test.tex file is in and use this simple LaTeX code to implement the image in it:
	\documentclass{article}
	%The package tikz is available in pgf
	\usepackage{tikz}
	\begin{document}

	\begin{figure}
		%Do not try to scale figure in .tex or you loose font size consistency
	    	\centering
		%The code to input the plot is extremely simple
		\input{plot_test.tex}
		%Captions and Labels can be used since this is a figure environment
		\caption{Sample output from tikzDevice}
		\label{plot:test}
	\end{figure}
	\end{document}
The result should look like this. As you can see, LaTeX symbols are now properly written, the font is also similar to the rest of the document and the plot can be inserted in your LaTeX document !
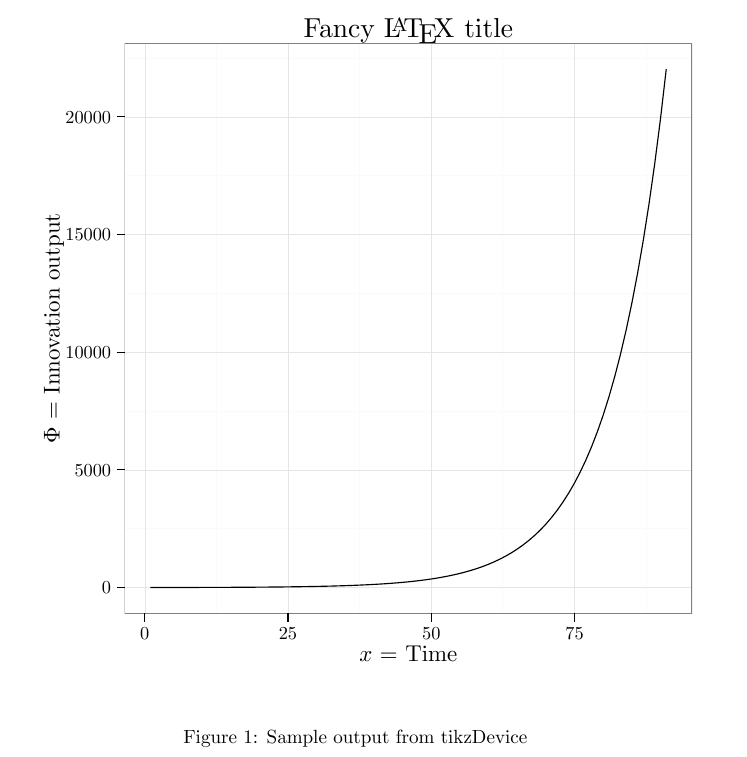
A problem you might still have: the font size of the plot title and axis legend and their positions. You can easily modify the sizes using the rel() function to scale the font size of each element. To modify the position of the axis legends or title plot, you can use the vjust and hjust parameters for vertical and horizontal positioning. R will not prepare your plot for the LaTeX font and sizes, so you will probably need to move the title and axis titles or they will probably touch the plot itsel at some point (visible in the previous LaTeX plot). To correct it, use something similar to this:
        plot + theme(plot.title = element_text(size = rel(1), vjust = 0),
        axis.title = element_text(size = rel(0.8)),
        axis.title.y = element_text( vjust=2 ),
        axis.title.x = element_text( vjust=-0.5 ))
If you liked this post, you can share it with your followers or follow me on Twitter!